Report
Designer
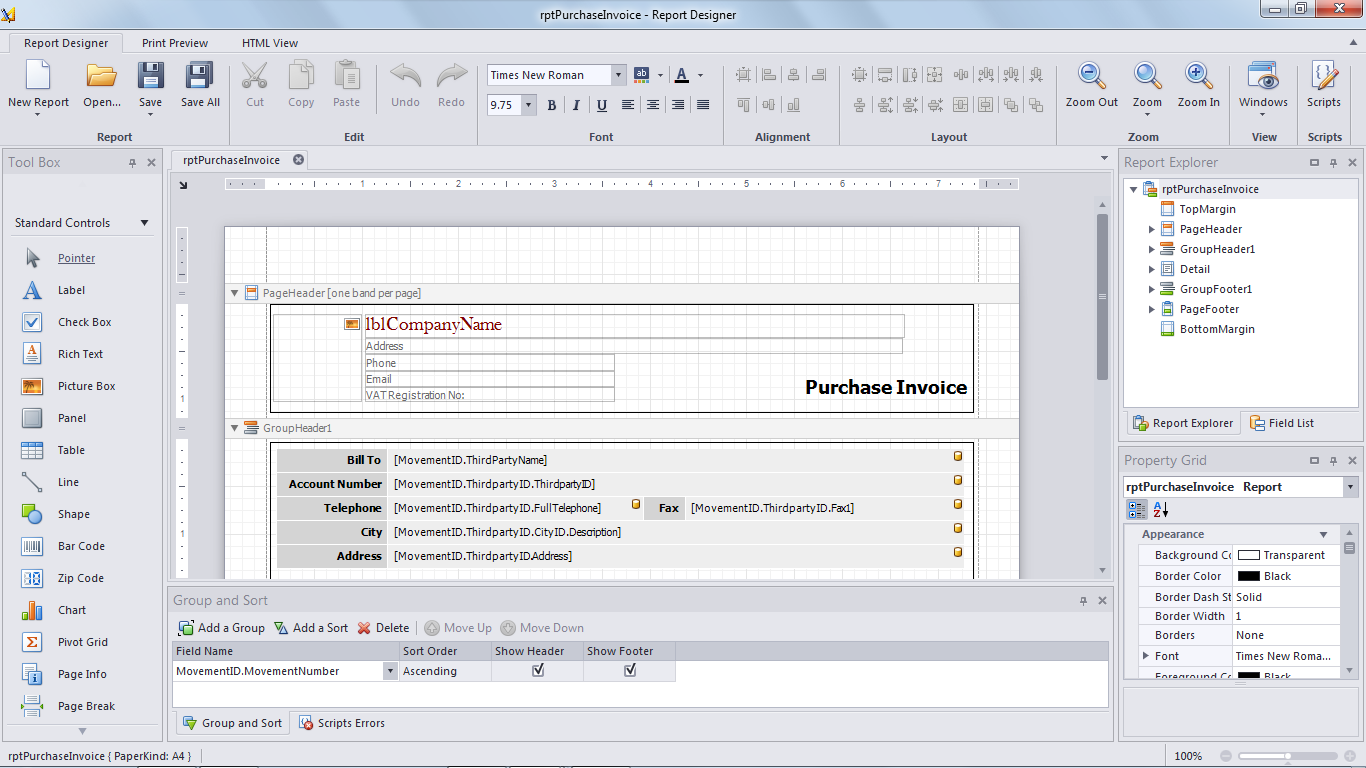
Intuitive report designer allows you to modify existing application reports in order to customize the information to meet your needs. In addition, you can easily create your own reports based on a set of criteria. This gives the user flexibility in customizing their reports without the need for third party intervention. Report Designer is built-in to LeERP giving a wide range of rich features to the end user.
The standard controls allows you to add pointers, check boxes, rich text, pictures, lines, tables, panels, bar codes, zip codes, charts, pivot codes, and page information. You have the option to group and sort your data by adding a new group, specifying sort order (ascending/descending), and showing header and footer as well as changing the field location.
An easy to use field explorer allows you to view the details of each field and its specifications. The field explorer can be toggled from the default report explorer view to a more traditional (logical) field list. You can access the property grid to change field attributes such as appearance (background color, border, border width), font, padding, style, behavior and much more.
User is able to export the layout to more than 15 formats (such as Adobe PDF, HTML, Image, Microsoft Excel, text file, csv, etc.). You can email the report, add page background (such as watermark). change the page color as well as use the advanced filter.
Report Designer has auto-correct features that warns the user when certain report elements overlap and will create errors allowing the user to make the appropriate changes before final report generation.
